Today
What did I do today, and did it move anything?
A daily debrief with split progress bars that show today's contribution to each subject — not just a time total.
AllStudyRevision
The Focus tab records your study time. These four screens are where that time turns into something you can actually read — a daily debrief, a long-view graph, a streak with real teeth, and a correctable session log. All four read from a single record, so they can never disagree.
They sit in a bar along the bottom of the Focus tab and share the same underlying session data — so correcting one updates all four.
A daily debrief with split progress bars that show today's contribution to each subject — not just a time total.
A long-view graph over 7, 14, 30 days or all time, with per-subject breakdowns that catch imbalance fast.
Streaks, daily targets, recovery days, milestone badges, and a 15-week contribution graph — consistency over volume.
Every session you've ever saved, newest first — editable and deletable, with all downstream numbers recomputed instantly.
All / Study / Revision filter — A filter across the top of Today and Analytics lets you separate total study time from revision time, so "I put in six hours" and "but none of it was revision" become two different numbers.
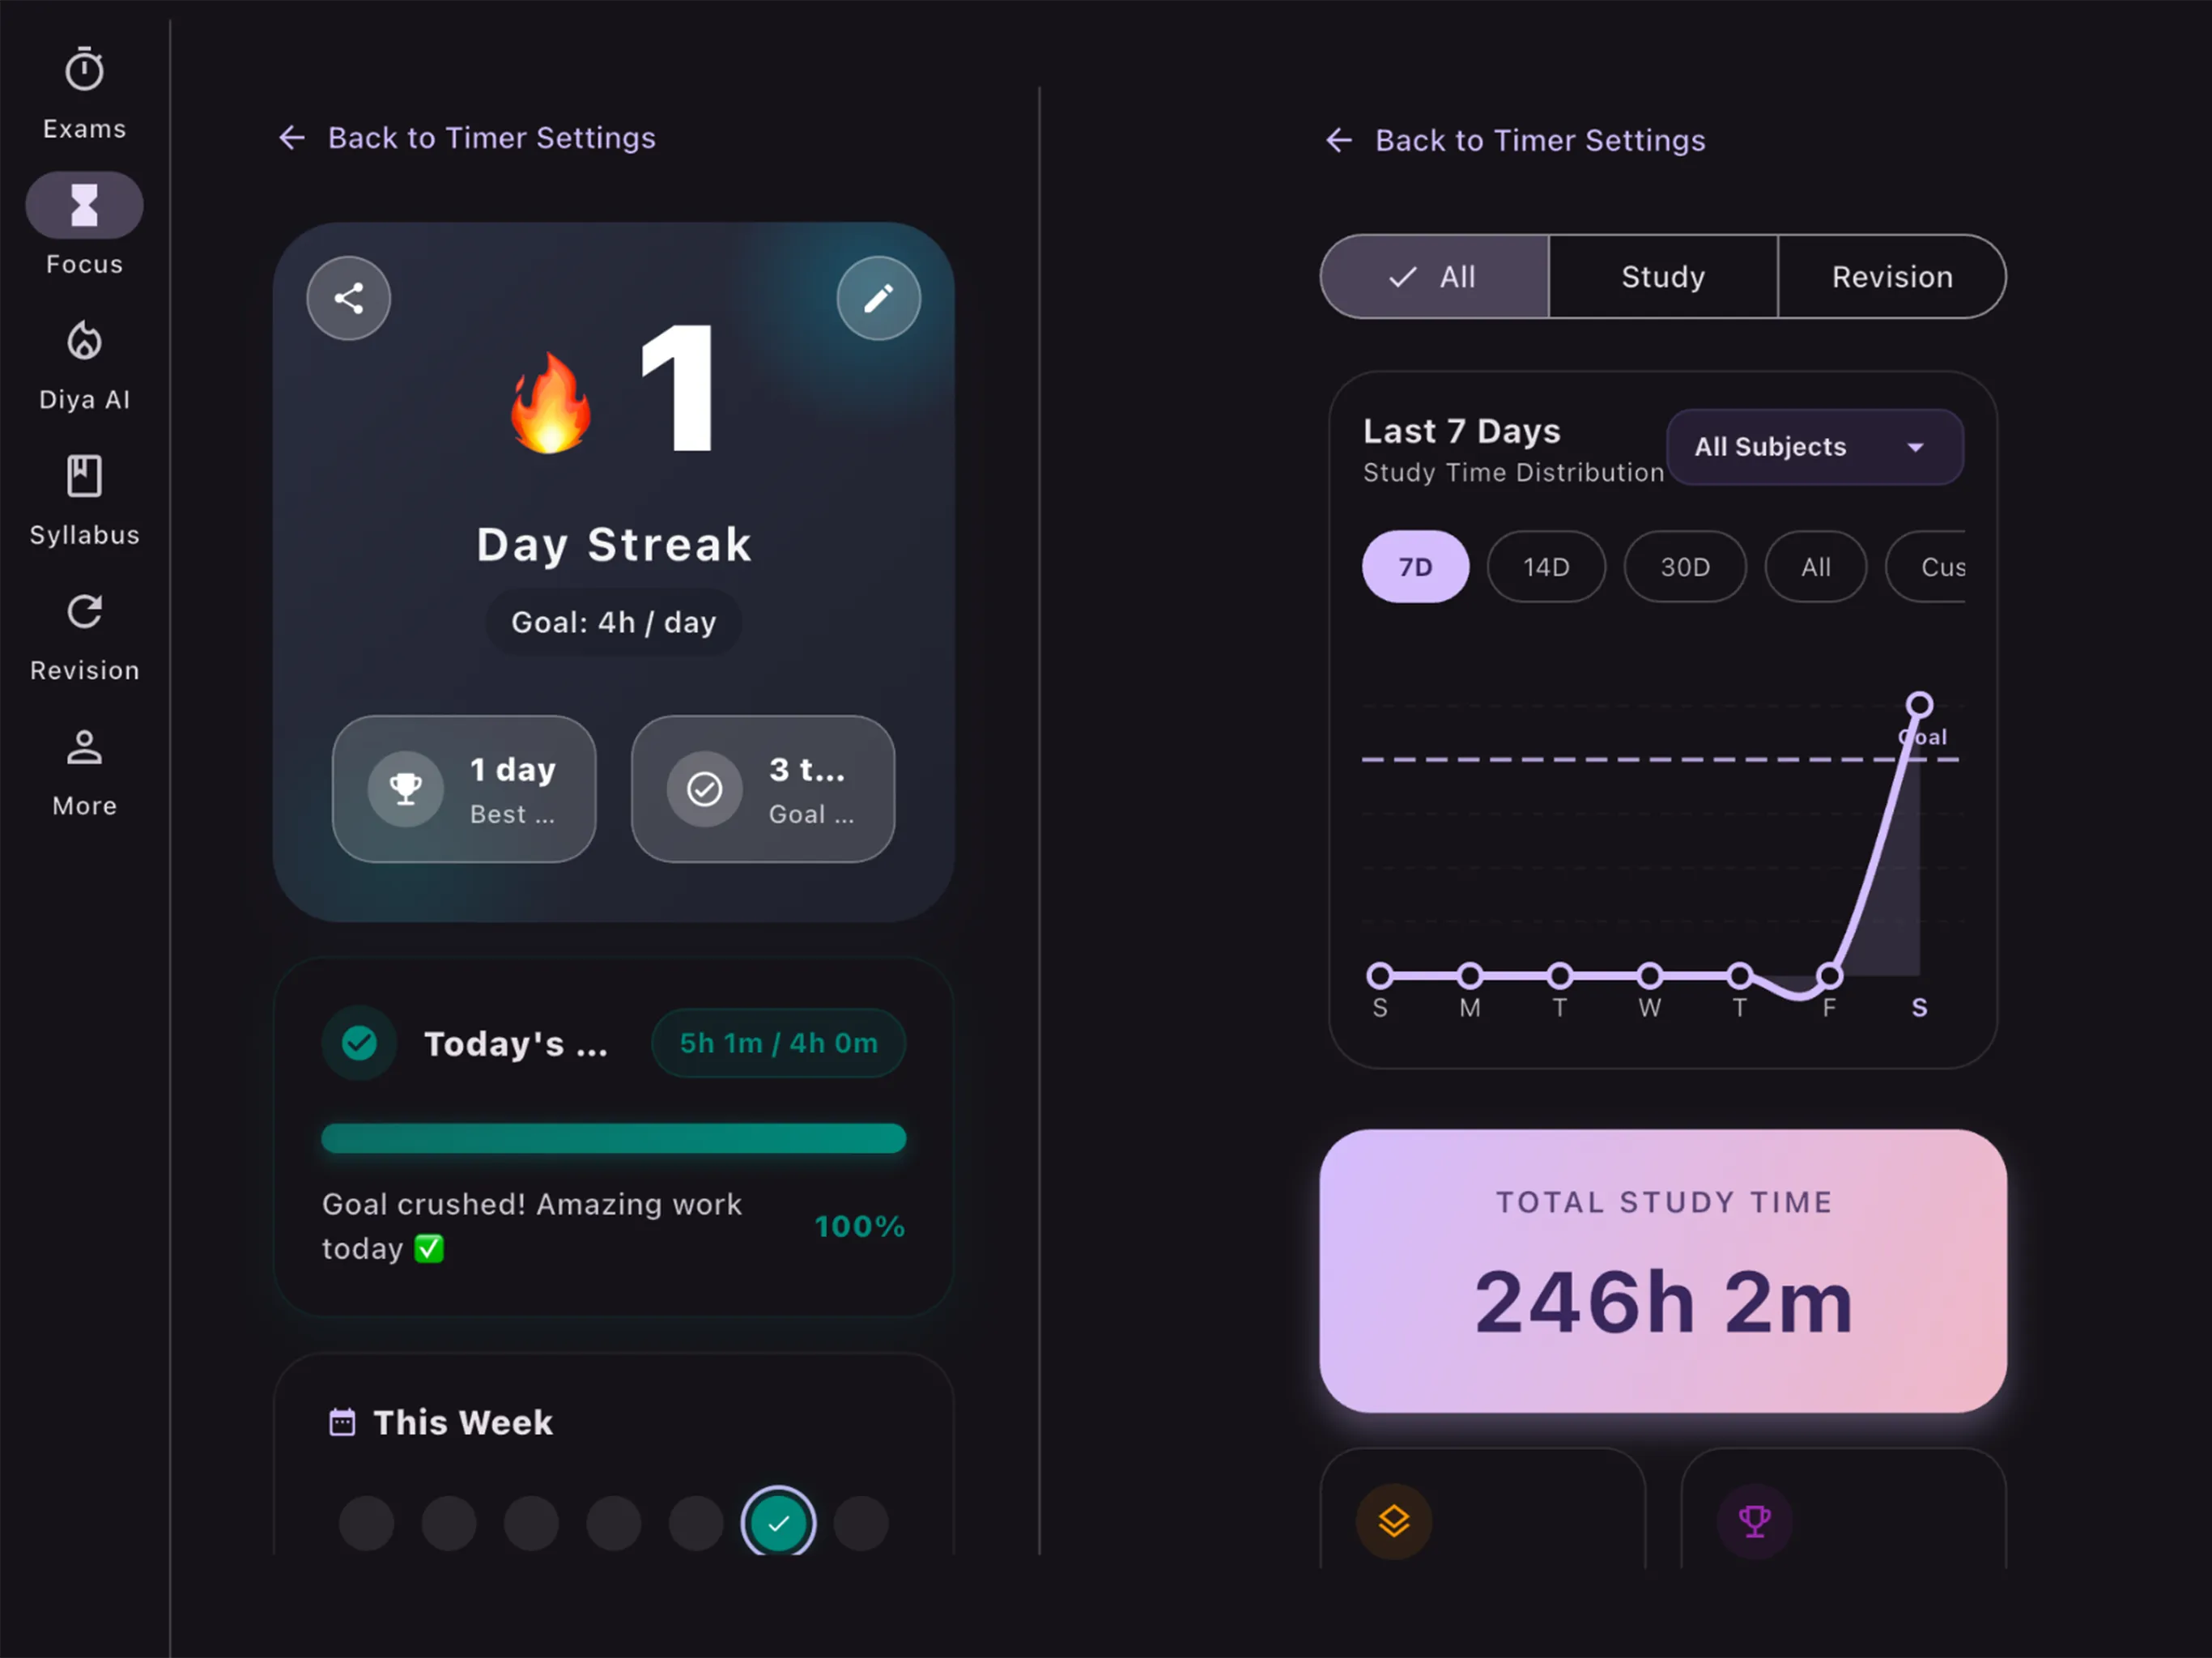
Analytics Screen: Study graph with goal line, subject time breakdown, and session stats
Every session you save from the Focus timer feeds all four screens simultaneously. Today and Analytics read those sessions over different time windows. Goal scores each day against your target. History is the source list itself — and the only place you can change it.
Because they share one source, they cannot disagree. Correct a session in History and Today, Analytics, your streak and your home-screen widgets all update together — there's no second number anywhere in the app quietly telling you something else.
Today only ever shows the current day, and it's built to answer one question a simple time total can't: did today's hours actually move the needle?
At the top is a 24-hour activity strip — one cell per hour, shaded by how much you studied in it. It opens already showing your busiest hour, and tapping any cell reads out that hour and how long you studied in it. Over a few weeks this quietly tells you something useful: when you actually focus best, versus when you think you do.
A donut chart splits the day's time by subject. Past five subjects it folds the smaller ones into a single "Other" wedge — beyond that a donut stops being readable at a glance. Below that: total time studied today, overall syllabus progress, and how much of that progress happened today.
Every subject and chapter has a progress bar split into two segments: a muted segment for where you already were before today, and a bright segment for the ground you gained today, sitting right at the leading edge.
A subject at 62% that moved 8 points today shows 54% muted and 8% bright. A badge next to it names the gain outright. Each subject expands into its chapters, each with its own time for the day and its own split bar.
A subject shows up on Today if you moved its progress, even if you never ran a timer on it. Marked three chapters complete while reading in bed? Dragged a slider up after a class? That appears here. The screen reports what you got done today, not merely what the stopwatch caught.
Everything you've ever logged, not just today. The screen that catches imbalance before it becomes a problem.
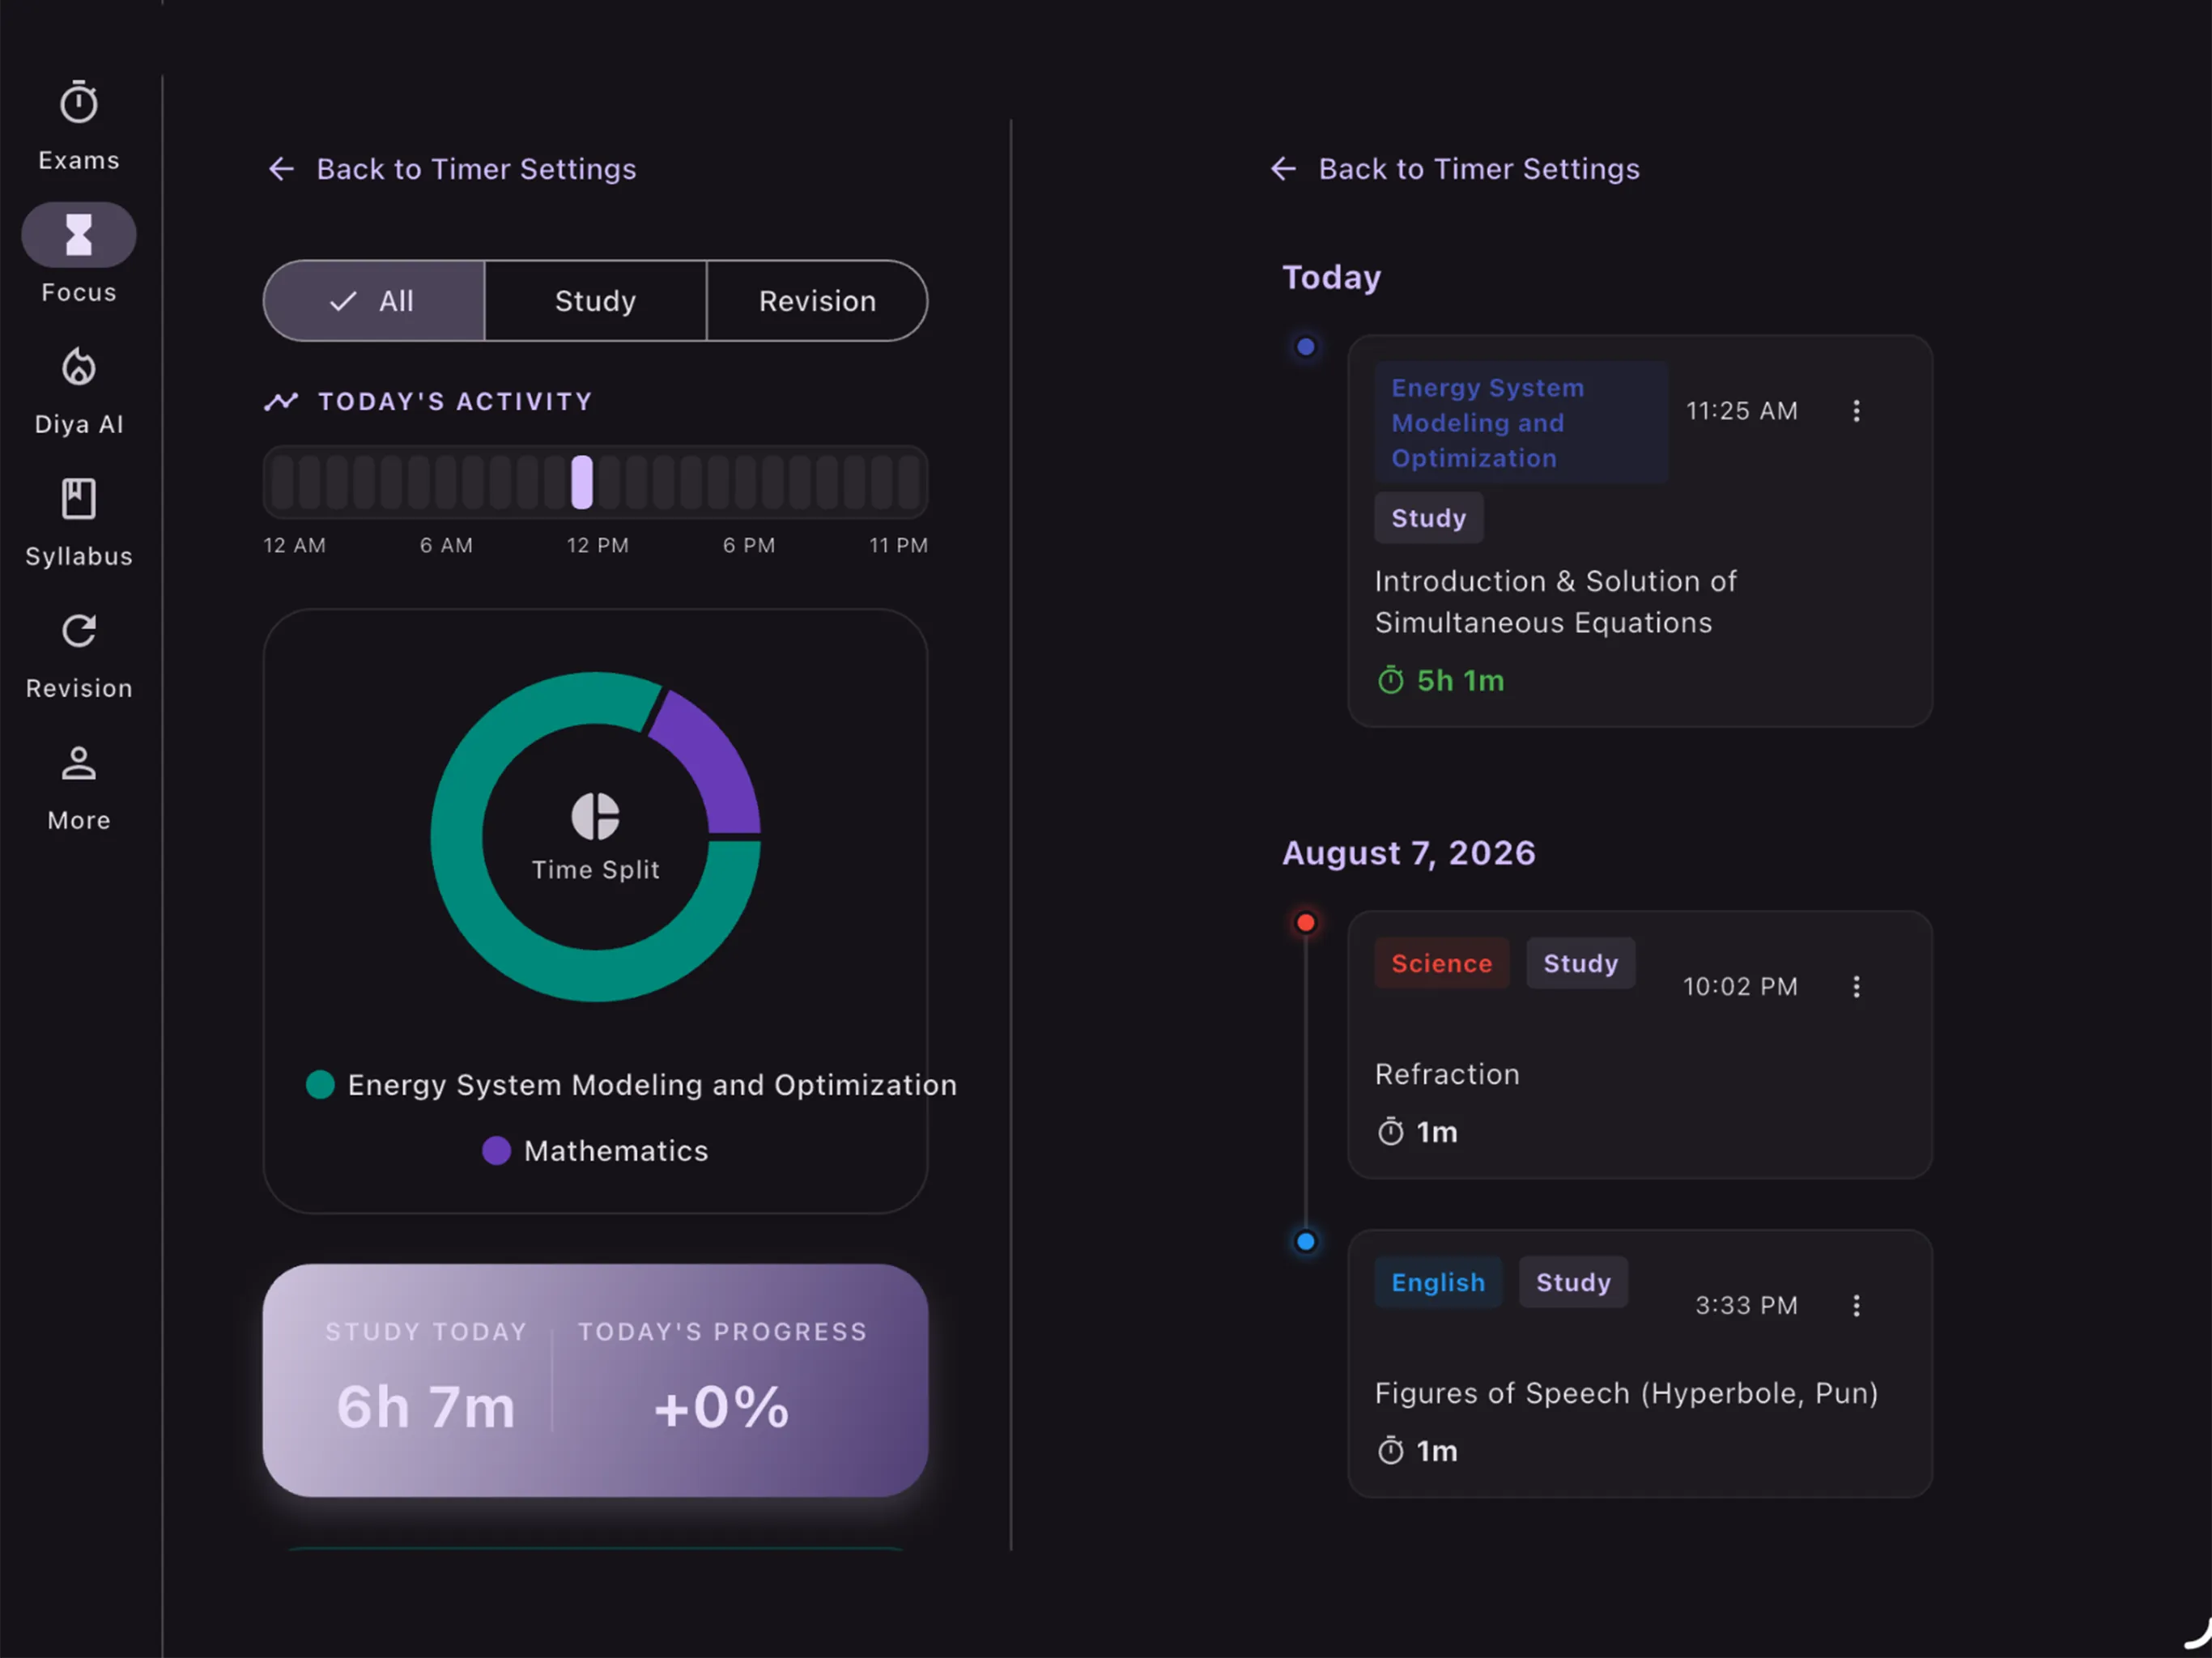
Analytics Screen: Subject breakdown sorted by time, expandable into per-chapter detail
A daily study graph across the top, with range buttons for 7 days, 14 days, 30 days, All time, or a custom date range you pick yourself. A dropdown filters it to a single subject, so you can ask "how much Chemistry have I actually done this month?" and get a straight answer.
Your daily goal is drawn across the graph as a horizontal line, so every bar reads instantly as over or under target — you don't have to do arithmetic to know how the month went.
Below that, every subject you've studied, sorted by time descending, each expanding into a per-chapter breakdown. The bar on each subject shows its share of your total study time — not its share of the top subject.
That distinction matters: measuring against the top subject would make your most-studied subject always render as a full bar, which reads like "syllabus complete" when it means nothing of the sort. This is the screen that catches imbalance. Four subjects, an exam in six weeks, and one of them has 40% of your hours while another has 6% — that's visible here in about three seconds, and nowhere else.
The 🔥 in the bar shows your live streak count. The screen behind it is about building a habit, not hitting a single big number.
Your daily goal is a target in hours and minutes. You set it during onboarding — Light, Moderate, Intense or Beast Mode — and can change it any time from this screen.
You can nominate one weekday as a recovery day with a lower goal of its own — or mark it a full rest day with a goal of zero, which counts as met automatically without any studying at all.
This exists because streak mechanics are cruel by default. Without it, one deliberate day off costs you a 90-day streak, and the app ends up punishing rest — which is not what a study app should do. Recovery days apply only from the date you enable them, so they can't retroactively repair streaks you already broke.
Current streak, longest streak, total goal days hit, your goal, and your consistency percentage — all in one place.
An animated bar toward today's goal, updating in real time as you study.
The last seven days at a glance. Recovery days are marked distinctly so a rest day never looks like a failure.
🌱 3 days · 🔥 7 · ⚡ 14 · 🏆 30 · 💎 60 · 🚀 100. Locked ones stay visible, and the screen tells you how many days remain until the next one.
About 15 weeks of daily activity as a grid of squares, shaded by how much you studied, with month labels along the top. The whole quarter of your effort in one picture.
Export your streak as an image card — the whole record in one shareable snapshot.
Every session you've ever saved, newest first. The only screen where you can change anything.
Sessions are grouped by day, with Today and Yesterday labelled as such and older days shown by date. Each entry shows:
You left the timer running through dinner; you studied 40 minutes and forgot to start it at all. Adjust the hours and minutes and save.
Remove a session outright — for duplicate saves, accidental records, or sessions that simply don't belong in your log.
Both immediately recompute everything downstream — your streak, daily totals, analytics, and widgets. The record is yours to correct, because a study log you can't fix is one you stop trusting, and then stop using.
They're four views of a single underlying record, not four separate trackers.
Read the same sessions over different windows — one day versus everything.
Reads those sessions per day and scores each against that day's target.
The source list itself — the only place you can change it. Every edit cascades to the other three screens immediately.
The full mechanics, section by section — pulled from the same source as the app itself.
A filter across the top of Today and Analytics lets you view All, Study only, or Revision only. This lets you separate "I put in six hours" from "but none of it was revision" — two very different things when an exam is coming up.
There is deliberately no Miscellaneous filter. Misc sessions carry no subject breakdown to chart, so they roll up under All. Filtering to Study or Revision drops them entirely.
The strip has one cell per hour of the day, shaded by how many minutes you studied in it. It opens already scrolled to your busiest hour — the one with the deepest shade — so you see the peak of your day immediately.
Tapping any cell reads out the hour label and the exact minutes you studied in it. Over a few weeks of checking this strip, a pattern usually emerges: you find that you actually focus best at a time that's different from when you think you do.
Every subject and chapter on Today has a progress bar that's split into two segments:
A subject at 62% that moved 8 points today shows 54% muted and 8% bright. A badge next to the bar names the gain outright. So you see your position and your day's contribution in the same bar, instead of a single number that looks identical whether you worked or not.
Each subject expands into its chapters, and each chapter carries its own time for the day and its own split bar.
A subject shows up on Today if you moved its progress, even if you never ran a timer on it. This is a deliberate design decision.
Marked three chapters complete while reading in bed? Dragged a slider up after a class? That appears on Today. The screen reports what you got done today — not merely what the stopwatch caught. Time is a proxy for effort, but it's not the whole picture.
The graph shows one bar per day, where each bar's height represents your total study time that day. Range buttons let you zoom to 7 days, 14 days, 30 days, or all time. A custom date range lets you zoom to any window you like.
A dropdown above the graph filters it to a single subject, so you can ask "how much Chemistry have I actually done this month?" and get a direct visual answer rather than trying to sum numbers in your head.
Your daily goal is drawn as a horizontal line across the graph. Every bar instantly reads as over or under target — you don't need to do arithmetic to understand how your month went. Bars above the line are goal days; bars below are not.
The bar on each subject shows its share of your total study time — not its share of the top subject's time. This distinction is important.
If you measured against the top subject, that subject would always render as a full bar. It would read like "this subject is done" when it actually means "this is your most-studied subject." That would obscure imbalance rather than surface it.
Measuring against total time means a subject with 6% of your hours appears as a 6% bar — correctly small, correctly alarming when an exam is six weeks away. Each subject expands into a per-chapter breakdown using the same metric.
The streak is computed by walking back through the last 365 days and asking, for each one, whether you met that day's goal. Three rules govern this:
If you haven't hit today's goal yet, the streak holds at what it was — the day is still in progress, not failed. The streak never penalises you for a day that isn't over.
A day in the past with no sessions, or sessions that didn't reach the goal, freezes the current streak at that point and the count restarts from the next day you did hit the goal. Your longest-ever streak is kept separately and never reset.
If you set a recovery day's goal to zero minutes, that day is automatically scored as "met" every week — with or without any studying. You keep your streak through a genuine rest day without the app pretending you studied.
You nominate one weekday as a recovery day. You can give it a lower but non-zero goal — "I still study a bit, just less" — or set its goal to zero to make it a full rest day.
Only from the date you actually enable the feature. If you enable recovery days on a Wednesday and nominate Sunday as your rest day, only future Sundays count. Past Sundays you didn't study are not retroactively repaired — the streak you broke before enabling this feature stays broken.
If you later disable the recovery day setting, it stops applying from that date forward. Past recovery days that were already scored as met remain scored as met — switching it off doesn't retroactively break streaks either.
Editing or deleting a session in History is not just a cosmetic change to a list item. It immediately triggers a full recomputation of:
There is no second number anywhere in the app that holds the old value. One correction, one truth, everywhere simultaneously.
The contribution graph on the Goal screen shows approximately 15 weeks of daily activity as a grid of squares, shaded by how much you studied that day — darker means more time. Month labels run along the top.
It gives you the whole quarter of your effort in one picture: you can see study blocks, gaps, a week of intense preparation before an exam, a recovery week after. Patterns that are invisible in per-day numbers become obvious at this scale.
The shading uses relative scale — the darkest square on your graph is your personal maximum, not an absolute number — so the graph is equally readable whether you study 2 hours a day or 8.
The Today screen shows your current day's study activity: a 24-hour strip shaded by hourly intensity, a donut chart of time by subject, a summary card with total time and syllabus progress, and split progress bars for every subject and chapter that moved today — showing today's gain separately from where you already were.
The streak counts consecutive days where you hit your daily study goal. Three rules keep it fair: today never breaks your streak (the day is still in progress), a missed past day freezes the current streak and the count restarts, and a zero-minute recovery day always counts as automatically met — no studying required.
A recovery day lets you nominate one weekday with a lower goal or a goal of zero. A zero-minute recovery day is automatically scored as "met" every week, protecting your streak from a deliberate rest day. Recovery days apply only from the date you enable them and cannot retroactively repair streaks you already broke.
Yes. The History screen lets you edit any session's length — to correct a timer left running, or to log time you forgot to track — or delete a session entirely. Every edit immediately recomputes your streak, daily totals, analytics graph, and home-screen widgets.
Each subject's bar shows its share of your total study time, not its share of the top subject's time. Measuring against the top subject would make that subject always appear as a full bar — looking like "complete" when it means nothing of the sort. Measuring against total time makes imbalance visible at a glance.
Yes, immediately. Editing or deleting a session triggers a full recompute of your streak, daily totals, analytics graph, and home-screen widgets. There is no cached or secondary number that holds the old value — one correction updates everything at once.
Daily debrief. Long-view analytics. Streak tracking. Editable history. All free, all in one app.